Mattel Financial Statement Analysis
This project involved a team of four women who thoroughly analyzed the financial statements of Mattel and Hasbro for the years 2022 and 2023. Our primary focus was on calculating and interpreting key financial ratios to evaluate the companies’ liquidity, solvency, and profitability. We found that Mattel had stronger liquidity compared to Hasbro, with better inventory turnover and a healthier debt-to-assets ratio, signaling more efficient cash flow management and lower reliance on debt. Despite a decline in profitability, with lower profit margins and returns on assets over the past two years, Mattel still outperformed Hasbro in areas like asset management and generating positive returns, showing its ability to remain financially stable and resilient. In contrast, Hasbro faced a negative profit margin and less efficient asset usage.
Our analysis also revealed areas where both companies could improve. For Mattel, a key area of focus was accounts receivable turnover, as the company could benefit from implementing strategies to collect payments faster, like offering discounts for early payments or charging fees for late ones. Additionally, both companies could improve profitability by exploring new revenue opportunities, such as increased licensing agreements or further expansion into digital media. These recommendations, along with improved asset and cash flow management, could position Mattel for continued growth and a more competitive standing within the toy industry.
Ratios Calculated Through Google Sheets
| Mattel, Inc. - 2022 | Hasbro, Inc. - 2023 | ||||
|---|---|---|---|---|---|
| Account | 2023 | 2022 | % Change | Account | 2023 |
| Current Ratio | 2.33 | 2.30 | +0.01 | Current Ratio | 1.13 |
| Inventory Turnover | 3.90 | 3.53 | +0.10 | Inventory Turnover | 3.38 |
| Days in Inventory | 93.61 | 103.27 | -0.09 | Days in Inventory | 107.92 |
| Accounts Receivable Turnover | 5.60 | 5.62 | -0.003 | AR Turnover | 4.63 |
| Avg Collection Period | 65.14 | 64.91 | +0.0035 | Collection Period | 78.85 |
| Debt to Assets | 0.67 | 0.67 | -0.0016 | Debt to Assets | 0.83 |
| Gross Profit Rate | 47.48% | 45.66% | +4% | Gross Profit | 65.90% |
| Profit Margin | 3.94% | 7.25% | -46% | Profit Margin | -29.77% |
| Return on Assets | 3.40% | 6.27% | -46% | ROA | -18.81% |
| Asset Turnover | 0.86 | 0.86 | -0.0021 | Asset Turnover | 0.63 |
Branding project coming soon!
Advanced Queries & Data Analysis
Working with data analysis and queries has taught me invaluable lessons in the world of information-driven decision making. First and foremost, I have learned the significance of precision and accuracy in analyzing data. A minor mistake or oversight can lead to misleading insights, potentially leading to faulty decisions. Therefore, attention to detail and thoroughness are critical while working with data.
I have come to appreciate the importance of scalability and efficiency when dealing with large datasets and complex queries in this tutoring business. Optimizing queries and employing appropriate data manipulation techniques not only saves time but also improves the overall performance of data analysis. The need for continuous learning and staying updated with the latest tools and techniques in data analysis is highly crucial. The field is constantly evolving, and keeping up with advancements enables me to stay at the forefront and conduct more meaningful and impactful analyses.
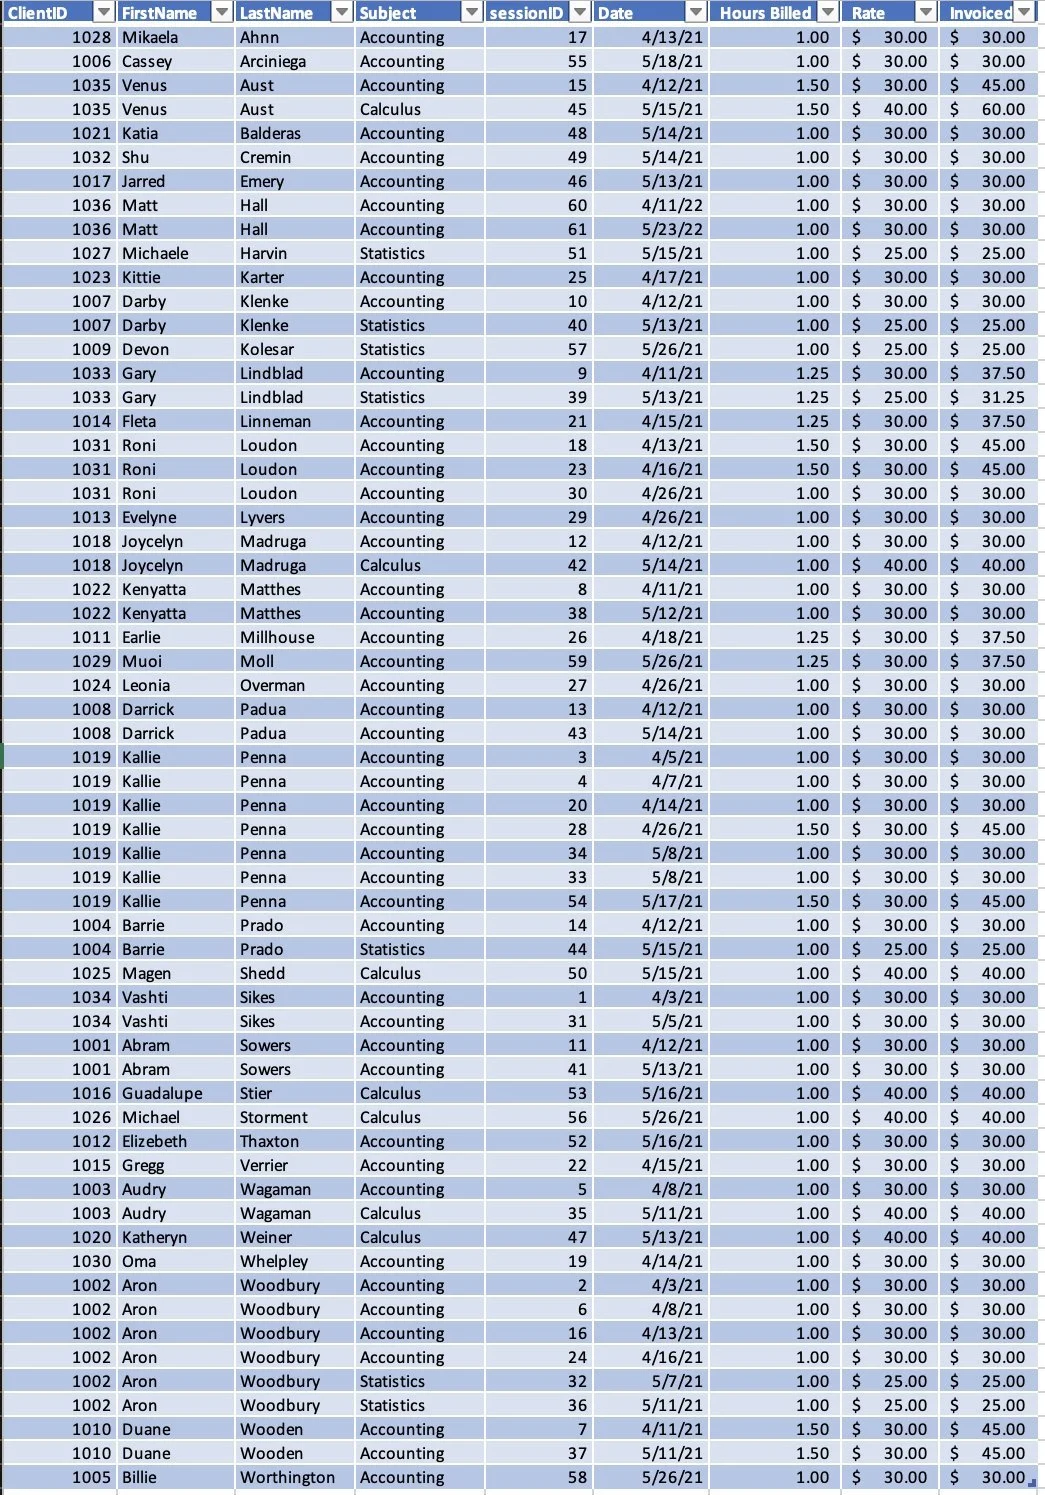
Microsoft Excel & phpAdmin SQL
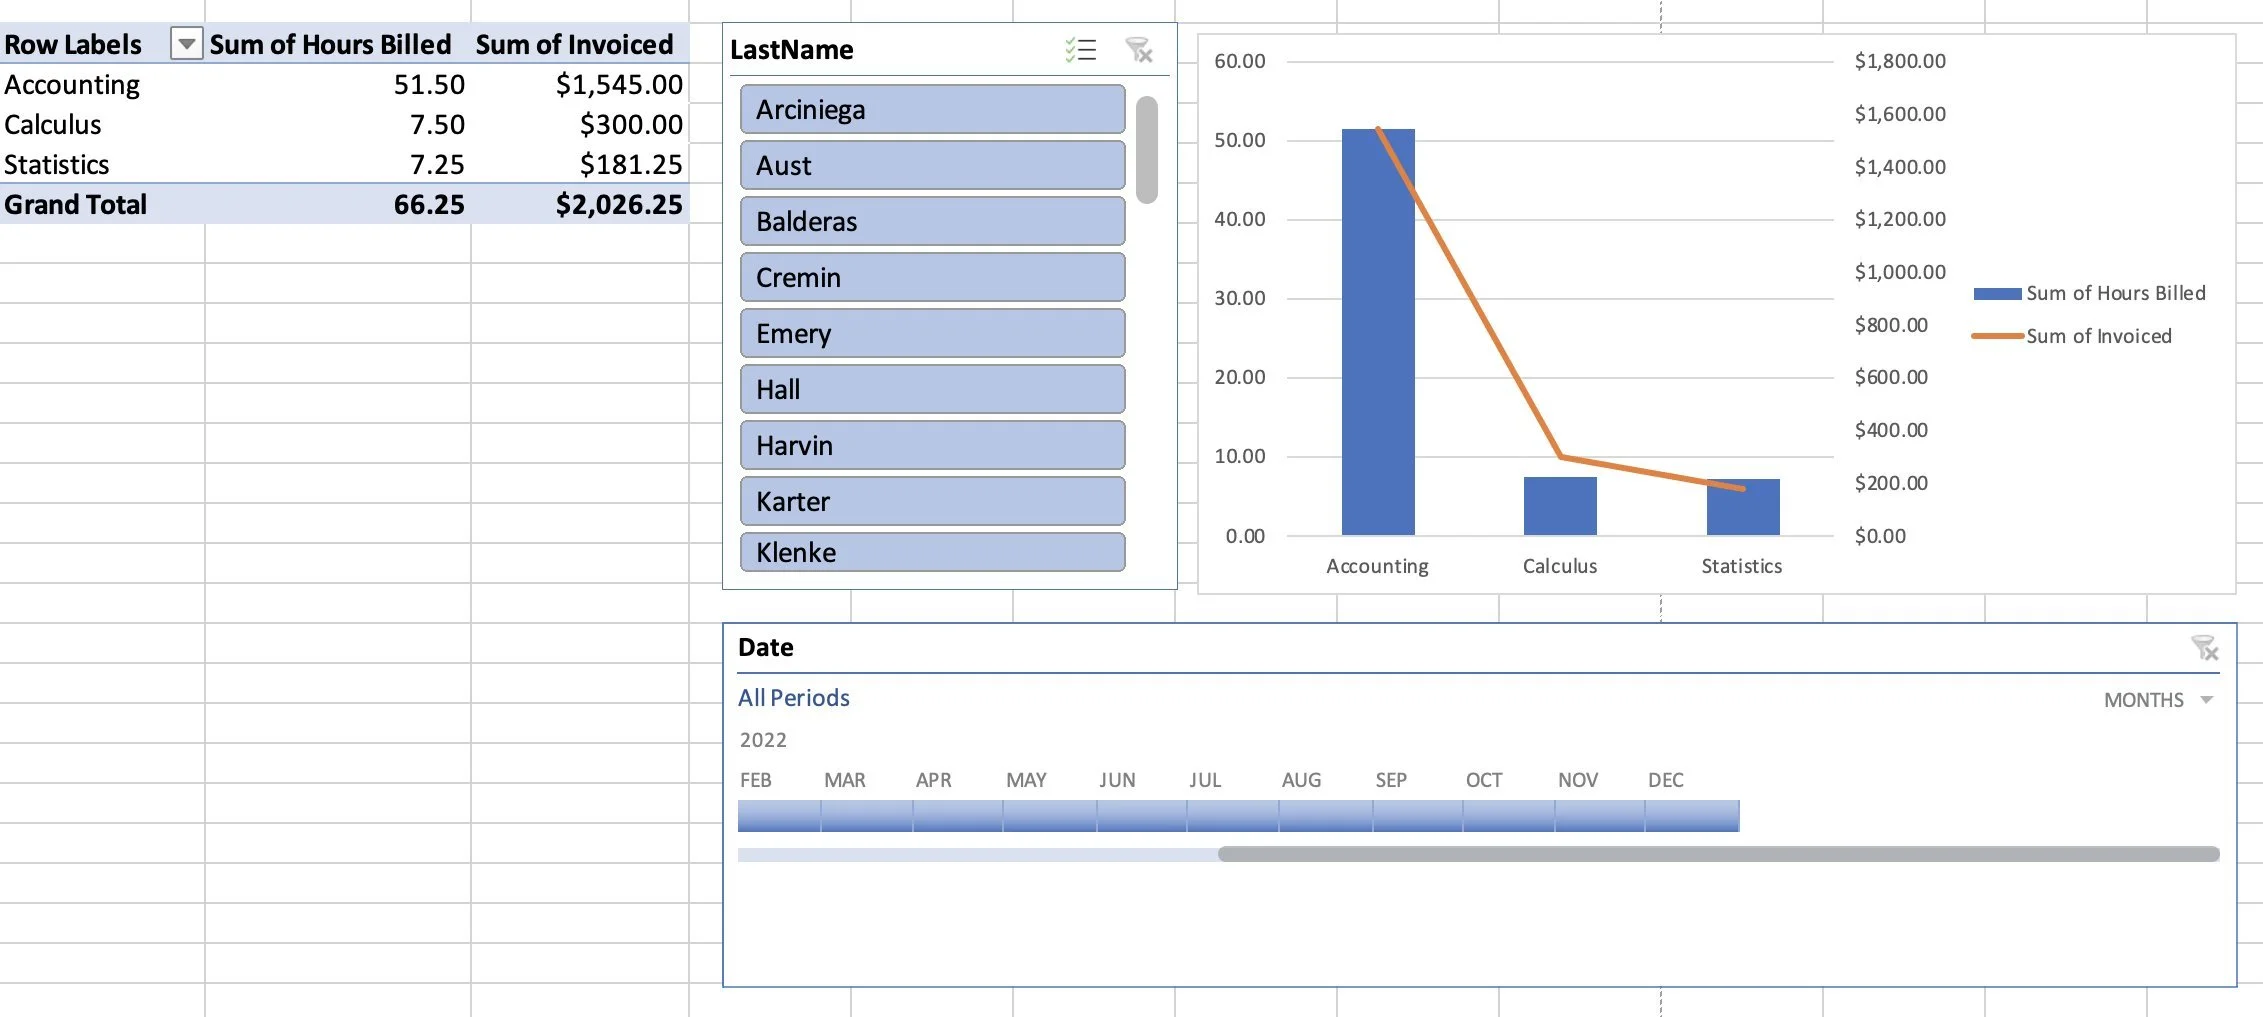
Service Hours & Invoice Summary
| Subject | Hours Billed | Invoiced Amount |
|---|---|---|
| Accounting | 51.00 | $1,545.00 |
| Calculus | 7.50 | $300.00 |
| Statistics | 7.75 | $181.25 |
| Total | 66.25 | $2,026.25 |